Incident-Pattern-Simulator
Incident Pattern Simulator + Incident Overlap 3D Explorer
The statistics of being in the wrong place at the wrong time
Beta Release
Two complementary interactive tools exploring the statistical foundations of “incident overlap” evidence in healthcare settings. Built as a pedagogical resource to help lawyers, journalists, statisticians, and the public understand why a nurse present at many incidents isn’t necessarily evidence of wrongdoing.
The current build now incorporates a key structural insight raised by Prof Richard Gill: real wards don’t randomly assign nurses — each shift has a roughly fixed headcount, and day shifts typically have more staff than night shifts. When you account for that, the range of “normal” overlap narrows, and day and night need separate benchmarks. The tools let you see this for yourself.
- Incident Overlap 3D Explorer (
incident_overlap_3D_explorer.html) — null “landscape” overview (Mean/Q95/Q99) with traffic light comparison tool - Incident Pattern Simulator (
Incident_Pattern_Simulator.html) — detailed single-scenario analysis
The Core Problem
When a nurse works more shifts than average, they will naturally be present at more incidents—simply because they were there more often. This simulator demonstrates that apparent “suspicious coincidence” often emerges from ordinary workload patterns, not wrongdoing.
What This Tool Does
The simulator runs thousands of Monte Carlo trials where:
- Incidents are placed randomly across shifts
- Nurses’ schedules are drawn from realistic workload distributions
- Overlap counts reveal how often the hardest-working nurse appears “suspicious”
Three staffing models are available:
- Unconstrained — the original independent workload model
- Fixed shift size — each shift draws an exact headcount, so nurses “compete” for limited slots
- Day/Night stratified — separate day and night regimes with different fixed shift sizes (Gill’s key point)
Key insight: The nurse who works the most will almost always have the highest overlap—regardless of guilt.
Try It
Launch the Incident Overlap 3D Explorer — Explore the null overlap landscape (3D surfaces) and compare observed values with traffic light indicators
Launch the Incident Pattern Simulator — Explore individual scenarios
Features
Three Analysis Modes
| Mode | What It Tests |
|---|---|
| Standard | Is this specific nurse’s overlap unusual given their workload? |
| Selection Effect | How does investigator bias inflate apparent coincidence? |
| No Pre-designation | What’s the expected maximum overlap when nobody is pre-selected? |
Statistical Framework
- Hypergeometric distribution for exact shift-based overlap
- Beta-binomial workload model with intuitive Mean/Consistency parameters
- Monte Carlo confidence intervals for key statistics
- 3D surfaces (“manifold”) default 5,000 trials per (M, p̄) grid cell
Efficiency note: For efficiency, trials are generated per (p̄, trial) and reused across the incident axis via prefix sampling; this keeps the per-cell distributions unchanged. - Ward staffing presets including parameters from O’Quigley (2025)
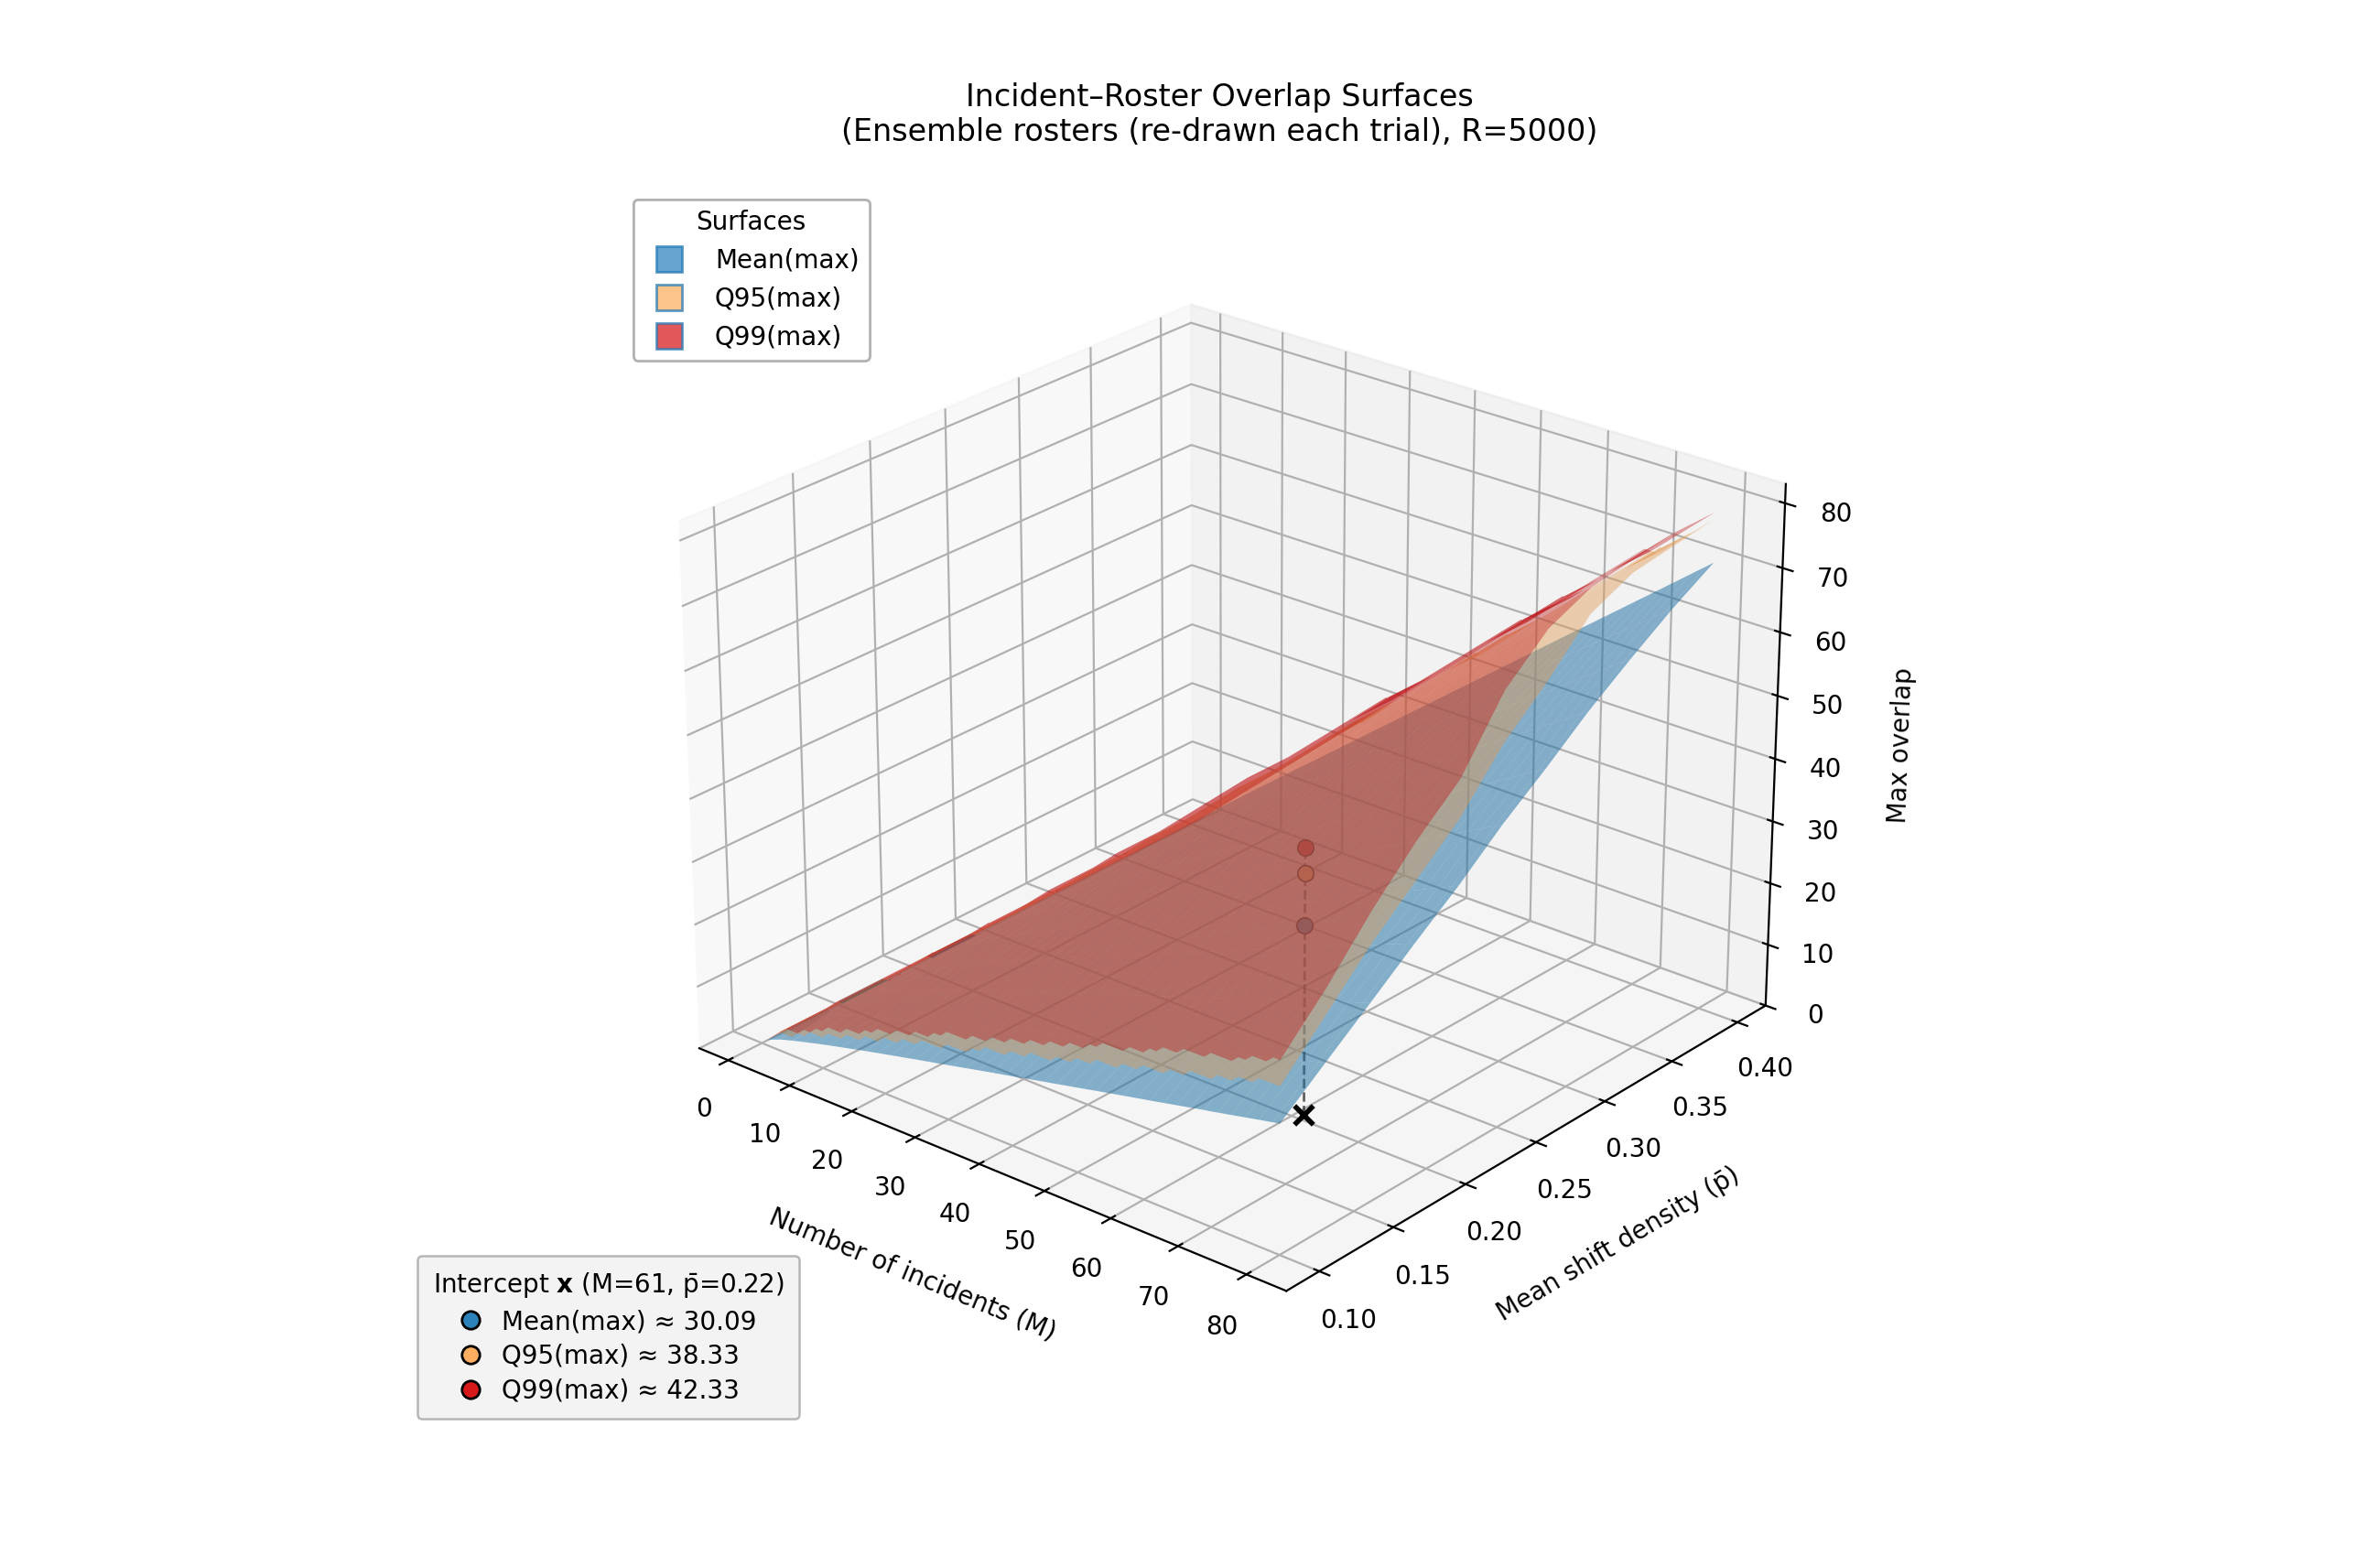
Incident Overlap 3D Explorer (the “manifold”)
Interactive 3D visualisation of how maximum incident overlap scales under the null hypothesis:
- Three statistical surfaces: Mean, Q95, Q99 percentiles across 5,000 Monte Carlo trials per grid point
- Two-parameter exploration: Number of incidents (M) vs mean shift density (p̄), with presence displayed as percentages
- Real-time interpolation: Drag the intercept marker to query any point on the surfaces
- Grounded baselines: What overlap counts are expected by chance alone?
- Traffic light comparison: Enter an observed overlap count to see a visual traffic light indicator (continuous):
- 🟢→🟠 Mean to Q95: colour transitions smoothly from green (at Mean) to orange (at Q95)
- 🟠→🔴 Q95 to Q99: colour transitions smoothly from orange (at Q95) to red (at Q99)
- 🔴 Above Q99: fully red (beyond the 99th percentile)
- When an observed value is entered, an additional marker appears in the 3D scene and an “Observed” entry is shown in the legend.
- Observed is bounded by M (total incidents); values above M trigger a warning and are clamped to M for display.
- M-Slice Profile panel with toggle between raw overlap and tail probability — the tail view answers Gill’s question: “How often would chance alone produce at least this many overlaps?”
- Day / Night regime toggle (visible only when manifolds were generated in day/night mode) — animated surface transitions let you compare day and night benchmarks side by side. In unconstrained or fixed mode there is no meaningful day/night distinction, so the toggle is hidden.
Terminology note: the documentation mostly says “surfaces”; the export artefacts use “manifold”. Here, “manifold” just means the set of three surfaces (Mean/Q95/Q99) over the (M, p̄) grid.
The surface/manifold data can be regenerated using incident_overlap_3D_generator.py with custom parameters.
Judicial Commentary
Side-by-side prosecution and defence framings of the same statistics, demonstrating:
-
The prosecutor’s fallacy (confusing P(evidence innocence) with P(innocence evidence)) - Why “present at 92% of incidents” means nothing without workload context
- The gap between mean outcomes and extreme peaks
Important Limitations
⚠️ Educational Purpose Only
This simulator is a teaching aid, not a forensic instrument. The models use simplified assumptions (uniform incident distribution, exchangeable shift probabilities) that may not hold in specific cases.
This tool must not be:
- Submitted as evidence in court
- Used to argue guilt or innocence
- Applied to real case data without qualified expert oversight
Any application to live cases requires verification by a Chartered Statistician (CStat, RSS), Accredited Professional Statistician (PStat, ASA), or equivalent.
Background Reading
- O’Quigley, J. (2025). “Use of roster charts in the investigation and prosecution of nurses suspected of inflicting deliberate harm on patients.” Medicine, Science and the Law
- O’Quigley, J. (2025). “Suspected serial killers and unsuspected statistical blunders.” Medicine, Science and the Law, 65: 28–35
- Gill, R. (2026). Walk-throughs and RPubs notes on the beta-binomial critique and constrained staffing
- Meester et al. — On the (ab)use of statistics in medical-legal cases
- Thompson & Schumann — Interpretation of statistical evidence in criminal trials
Documentation
Full technical documentation including mathematical framework, parameter explanations, and interpretation guidance is available in Incident_Roster_Analysis.docx.
The surface generator source (incident_overlap_3D_generator.py) includes detailed inline documentation of the Monte Carlo methodology.
Licence
MIT License — free to use, adapt, and share.
“Someone will always be the maximum. Being the maximum isn’t evidence of guilt.”